Mandatory and Discretionary Spending
The U.S. Treasury divides all spending into three groups: mandatory spending and discretionary spending and interest on debt. Interest on debt, which is much smaller than the other two categories, is the interest the government pays on its accumulated debt, minus interest income received by the government for assets it owns. This pie chart shows all projected federal spending in 2015 broken into these three categories.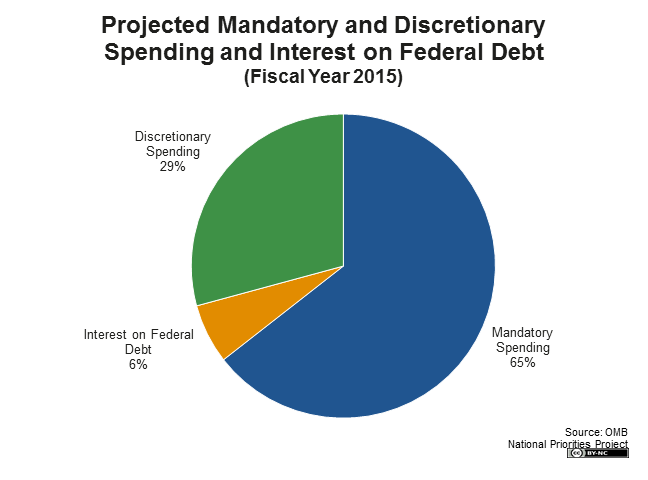
Discretionary spending refers to the portion of the budget that goes through the annual appropriations process each year. In other words, Congress directly sets the level of spending on discretionary programs. Congress can choose to increase or decrease spending on any of those programs in a given year.
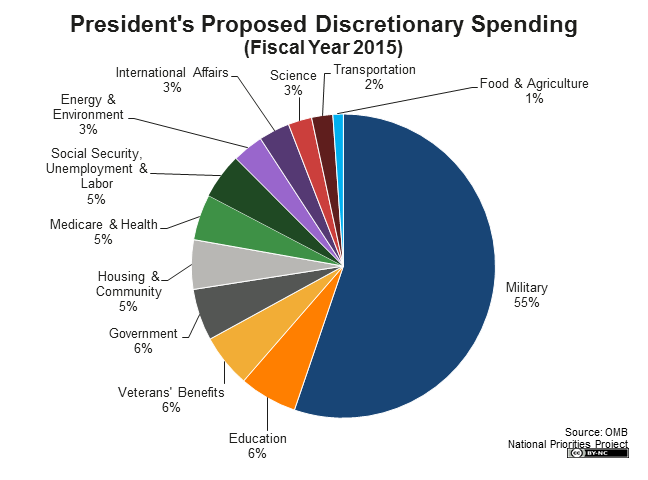
This pie chart shows how President Obama proposes dividing up $1.16 trillion in discretionary spending in fiscal year 2015.
Mandatory spending is largely made up of earned-benefit or entitlement programs, and the spending for those programs is determined by eligibility rules rather than the appropriations process. For example, Congress decides to create a program like the Supplemental Nutrition Assistance Program (SNAP), also known as food stamps. It then sets criteria for determining who is eligible to receive benefits from the program. The amount of money spent on SNAP each year is then determined by how many people are eligible and apply for benefits.
Congress therefore does not decide each year to increase or decrease the budget for SNAP. Instead, it periodically reviews the eligibility rules and may change them in order to exclude or include more people, and therefore change the amount spent on the program.
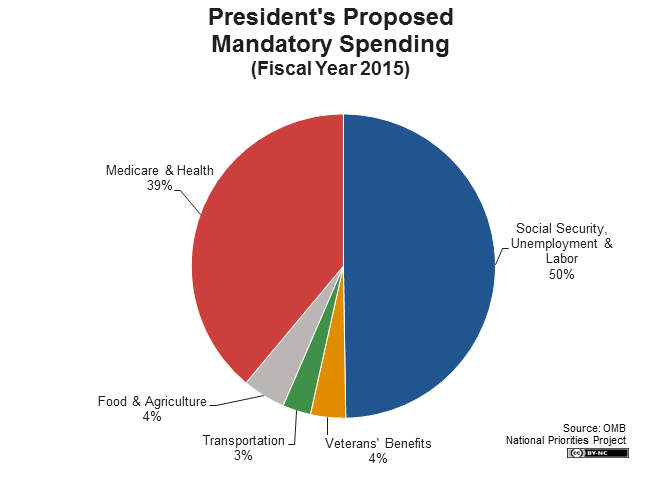
Mandatory spending makes up nearly two-thirds of the total federal budget. The largest mandatory program is Social Security, which comprises more than a third of mandatory spending and around 23 percent of the total federal budget.
This chart shows where the projected $2.56 trillion in mandatory spending will go in fiscal year 2015.
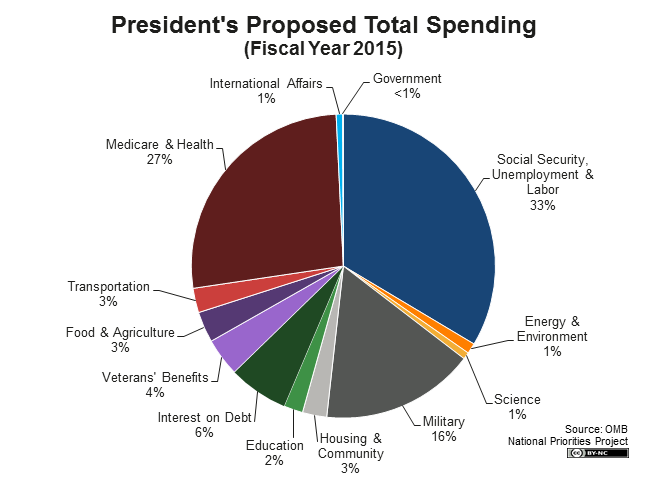
Finally, putting together discretionary spending, mandatory spending, and interest on the debt, you can see how the total federal budget is divided into different categories of spending. This pie chart shows how President Obama proposes dividing up the whole federal budget in fiscal 2015. Income security programs like Social Security and unemployment insurance together comprise the largest slice, followed by Medicare & Health, and Military.
Putting It All Together
Now you’ve read about the different kinds of federal tax revenue and the different types of spending. Here’s how it all fits together: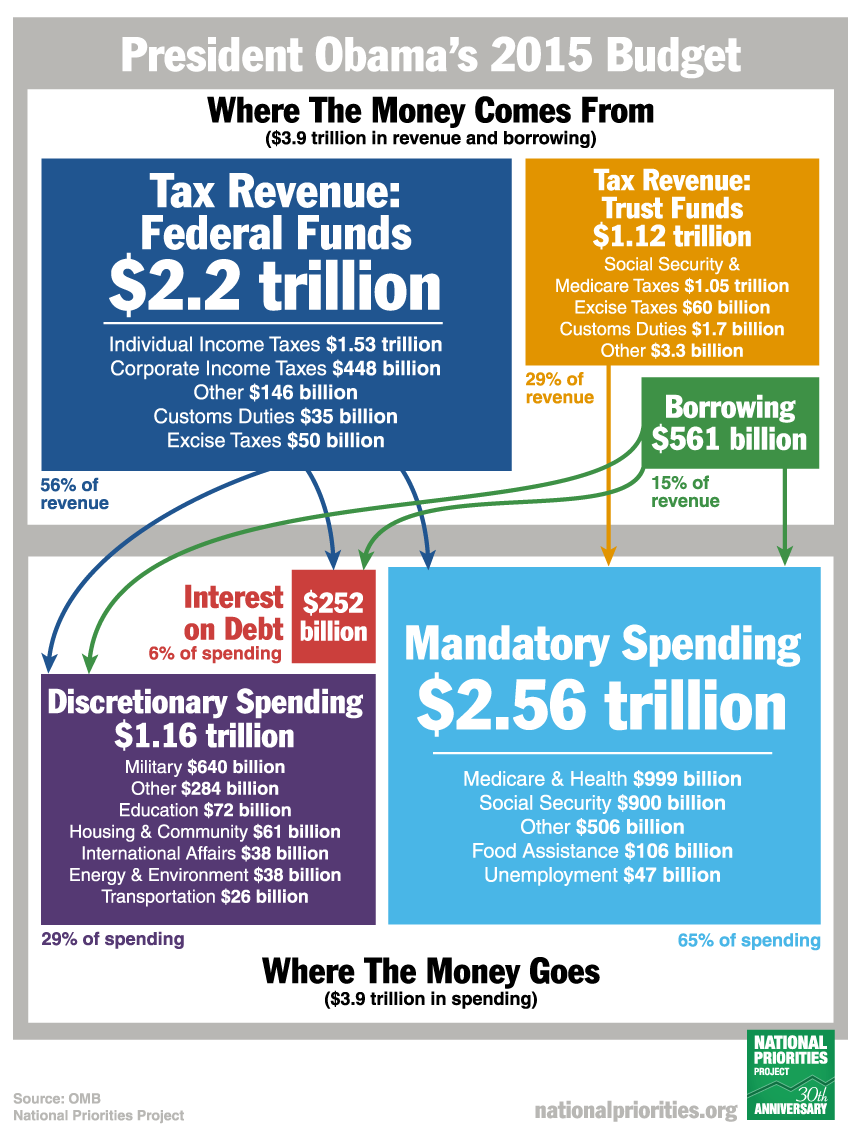
Spending in the Tax Code
When the federal government spends money on mandatory and discretionary programs, the U.S. Treasury writes a check to pay the program costs. But there is another type of federal spending that operates a little differently. Lawmakers have written hundreds of tax breaks into the federal tax code - for instance, special low tax rates on capital gains, and a deduction for home mortgage interest - in order to promote certain activities they deem beneficial to society. Those tax breaks function as a type of government spending. In fact, tax breaks are officially called tax expenditures within the federal government because, from the perspective of the government, they are no different from spending on any other government program. That's because, when the government issues a tax break, it chooses to give up tax revenue - so both spending and tax breaks result in the same outcome, which is less money in the U.S. Treasury. Under the president’s budget proposal, tax breaks are expected to cost the federal government $1.24 trillion in 2015 - more than all discretionary spending in the same year.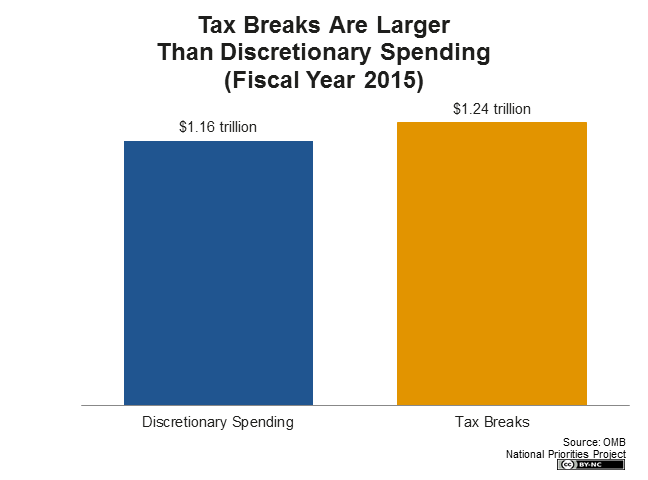
But unlike discretionary spending, which must be approved by lawmakers each year during the appropriations process, tax breaks do not require annual approval. Once written into the tax code, they remain on the books until lawmakers modify them. That means there is minimal oversight to ensure tax breaks actually achieve their intended purpose, even as they can grow in size from year to year as more taxpayers claim them for tax savings.
No comments:
Post a Comment